Market by order
CME market-by-order feed via Databento: every add, modify, cancel and fill, in sequence.
 Request access
Nodus · CME futures terminal
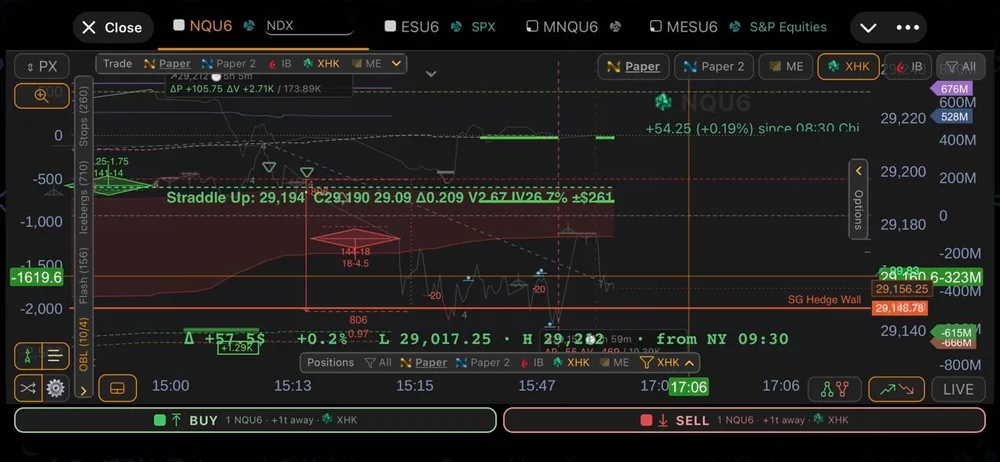
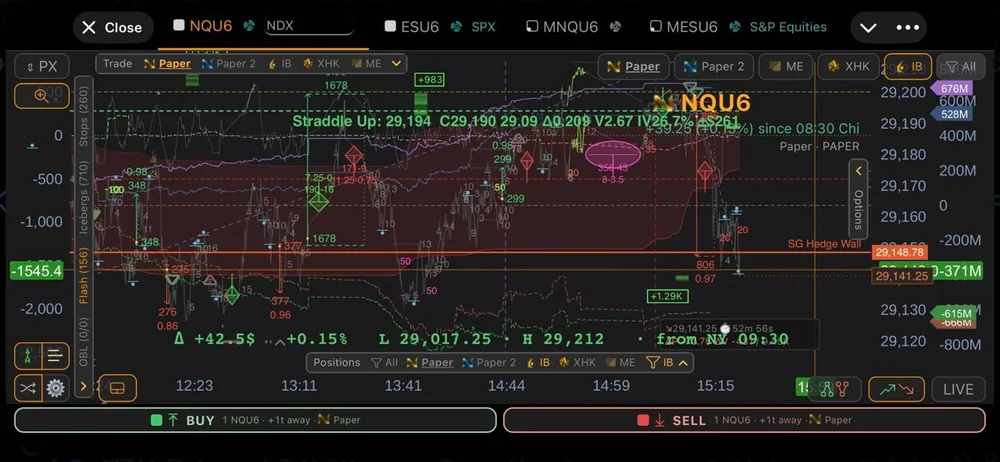
Nodus is a market-microstructure terminal for CME futures. It rebuilds the market from every single order, then puts structure, options context and execution on one chart.
01 · Volume-weighted time
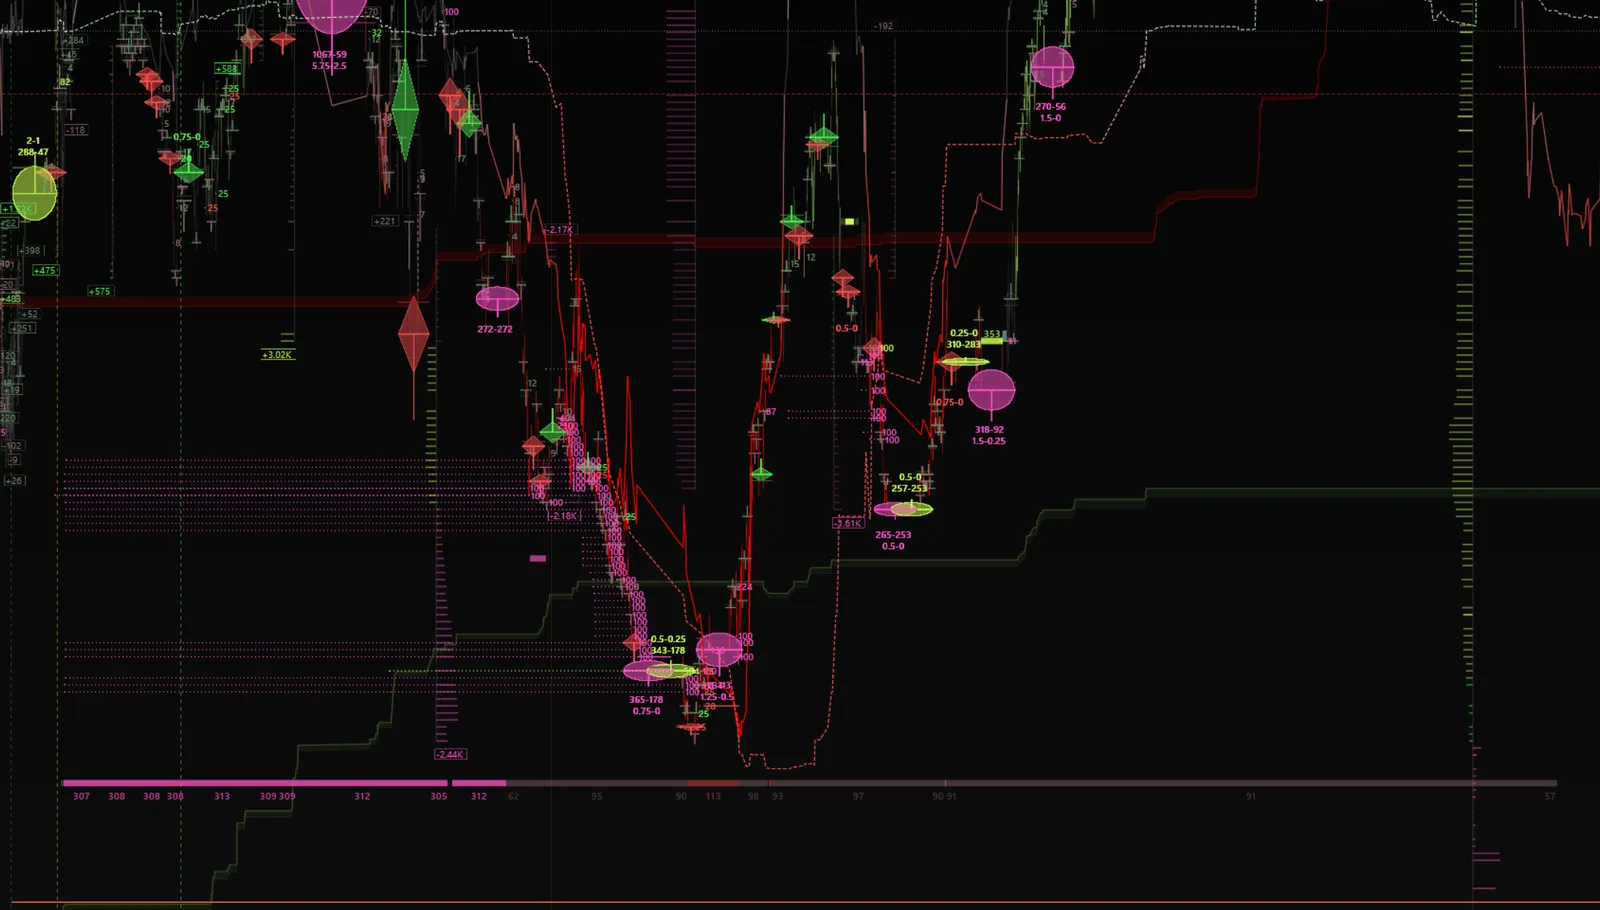
On a Nodus chart every hour is as wide as the volume it traded. Quiet stretches compress, busy minutes expand, and structure appears where the market actually did its work, not where the clock says it should.
02 · Market by order
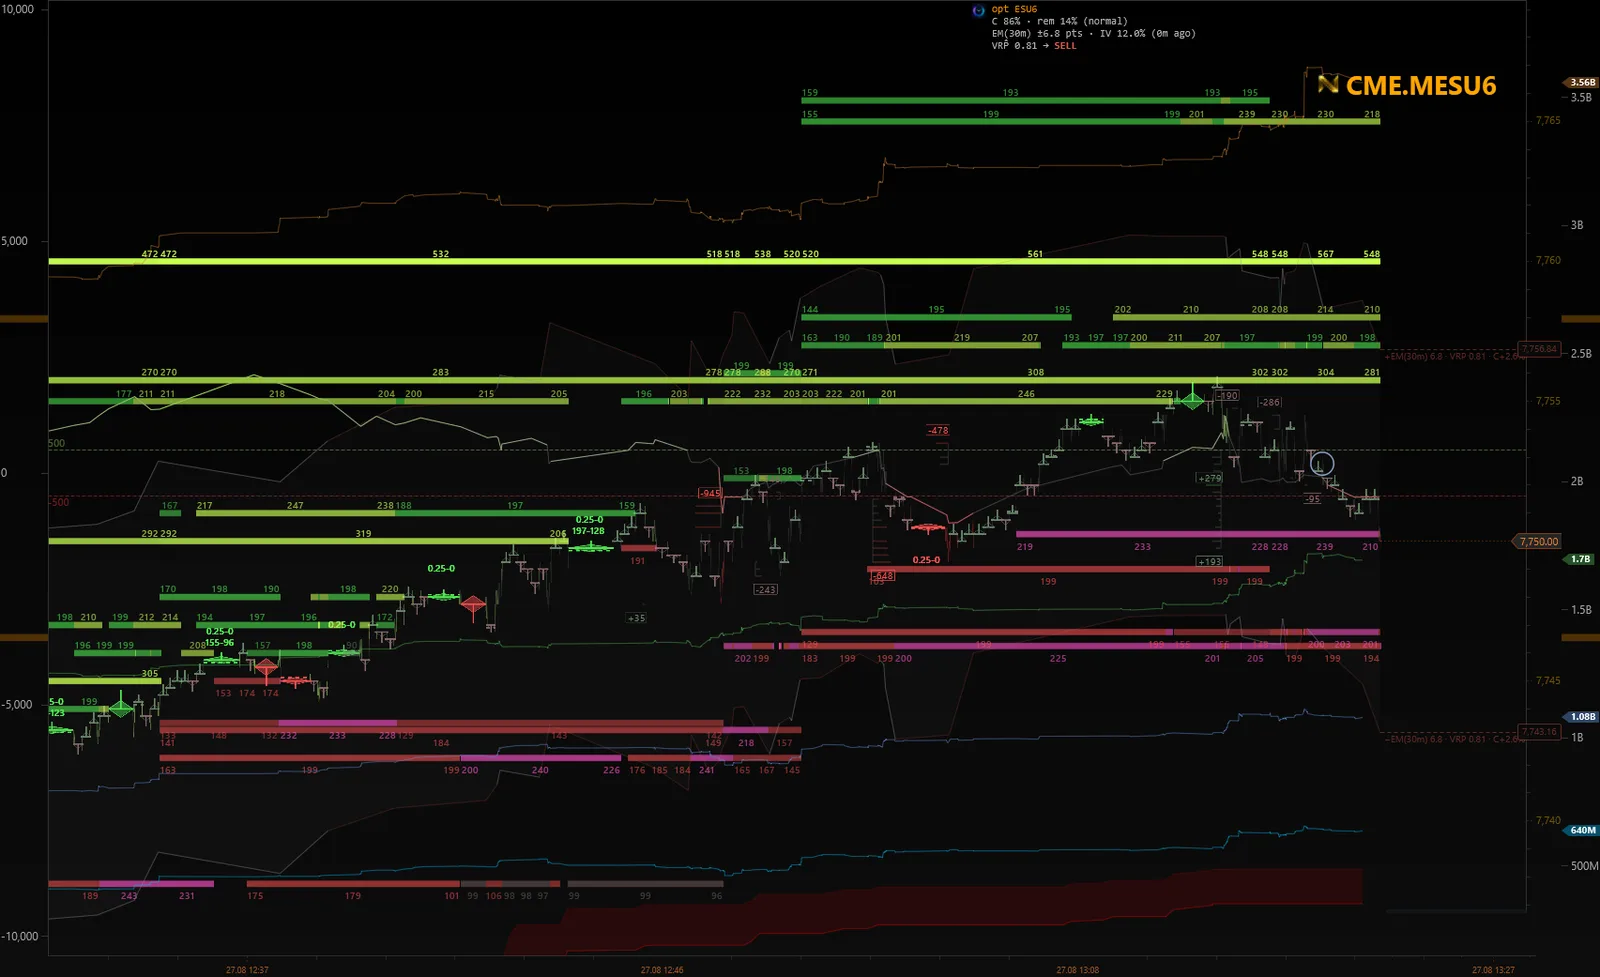
Nodus runs on CME market-by-order data. It follows each order from placement to fill, detects native icebergs as they refill, and keeps live order‑book levels drawn on the chart as they form and dissolve.
03 · Auction structure
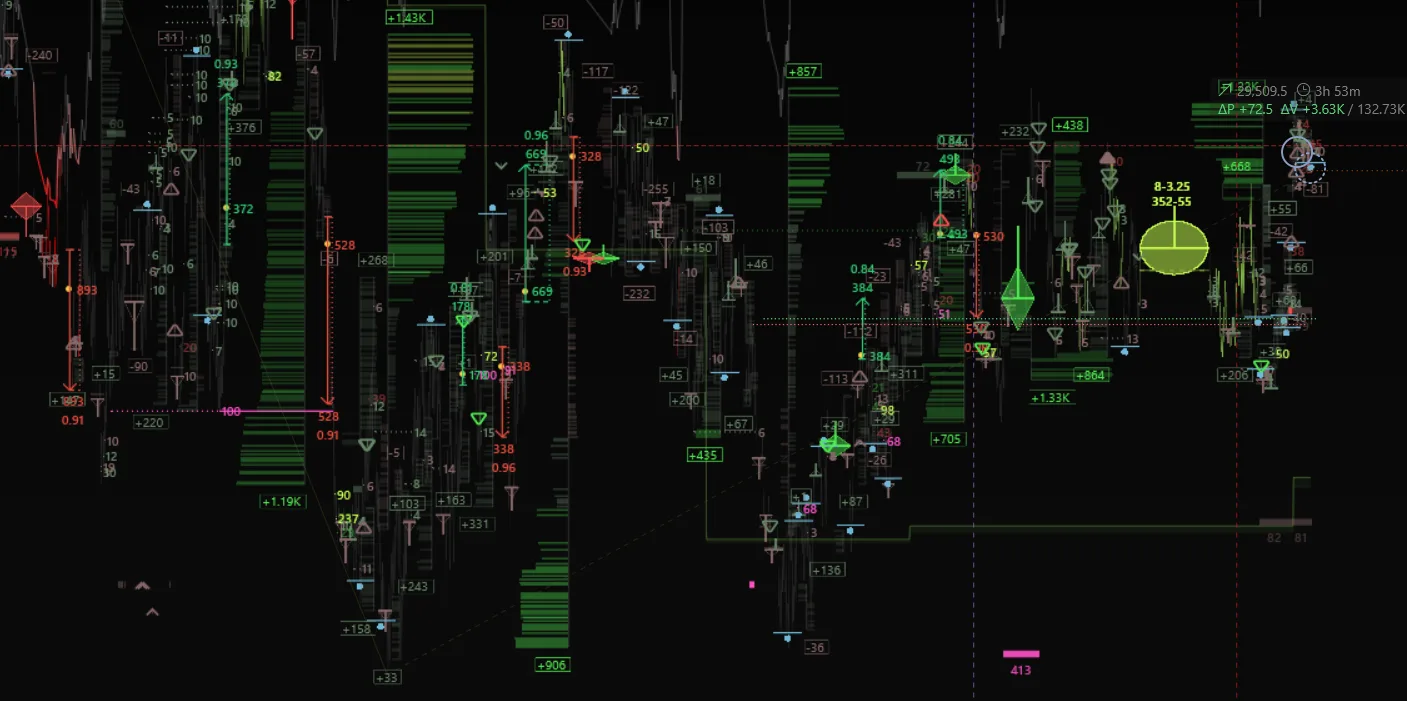
Auction Maker Nodes mark the prices where the market stopped to negotiate. Profile ladders, delta-shift colouring and cluster overlays show who was pressing and who was absorbing at each of them.
04 · Options context
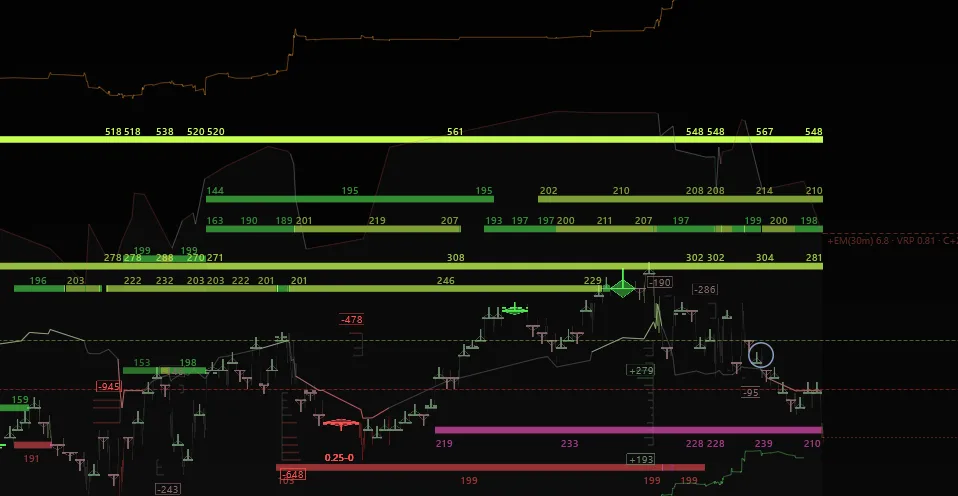
Same-day strikes tick along the price axis. The rolling at-the-money straddle and implied volatility draw as curves, next to the order flow they act on.
05 · SpotGamma inside
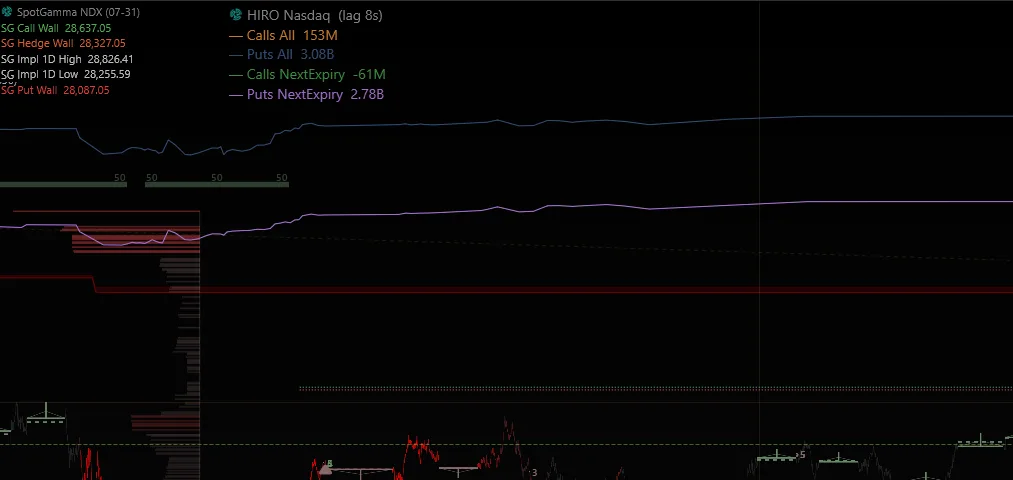
Nodus pulls your SpotGamma key levels straight from their API and draws them on the chart as lines: Call Wall, Put Wall, Vol Trigger, the implied daily range. HIRO dealer flow runs alongside in a live HUD with its own lag indicator, so hedging pressure is read at the level it hits, not in a separate window.
06 · Portfolio P&L
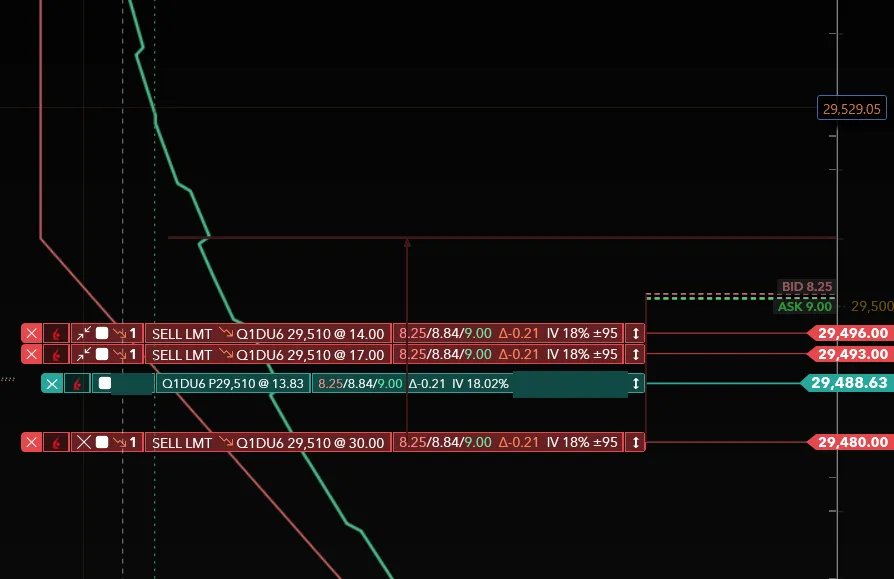
Futures and options together: Nodus draws the portfolio P&L profile across the price axis and recomputes it as positions change, so you see where the book pays and where it bleeds before price gets there. Option legs carry their greeks, implied volatility and bid/ask right in the row.
07 · Book Reflow
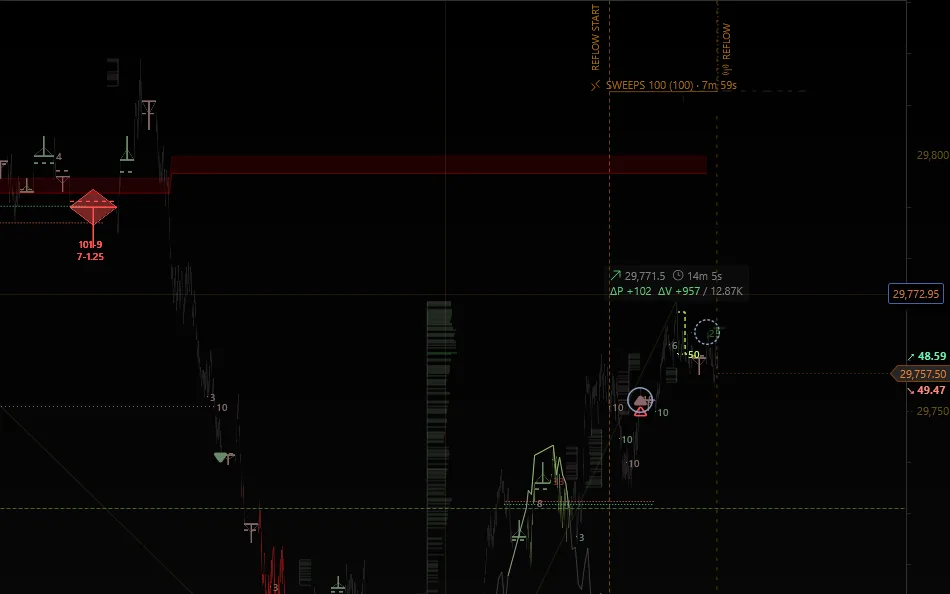
Every aggressive auction that clears a level starts a Book Reflow study: how much liquidity comes back to the swept prices, on which side, and how fast. The chart marks the study window and the selected sweep; the REFLOW panel holds the recovery curves on event time from 10 ms to seconds, the sweep tape, and Reflow T½ as the headline number.
08 · Execution
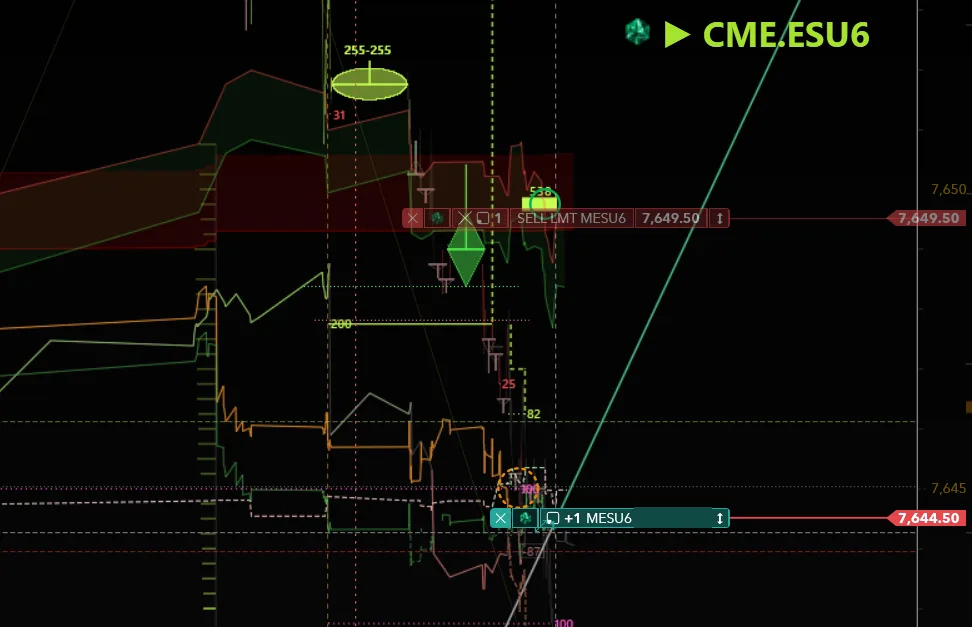
Buy and sell from the chart. Positions, stops and targets live as plaques where they sit on price. Paper trading is built in, live routing goes through Interactive Brokers, and every account is armed or disarmed explicitly.
09 · Away from the desk
The Nodus Mini App lives inside Telegram: the live chart, order‑book levels, icebergs and your positions, on the phone. The bot posts fills and can launch or close the terminal remotely. Everything reads a cache the chart publishes on its own schedule, so the phone never touches the chart.
10 · Research bench
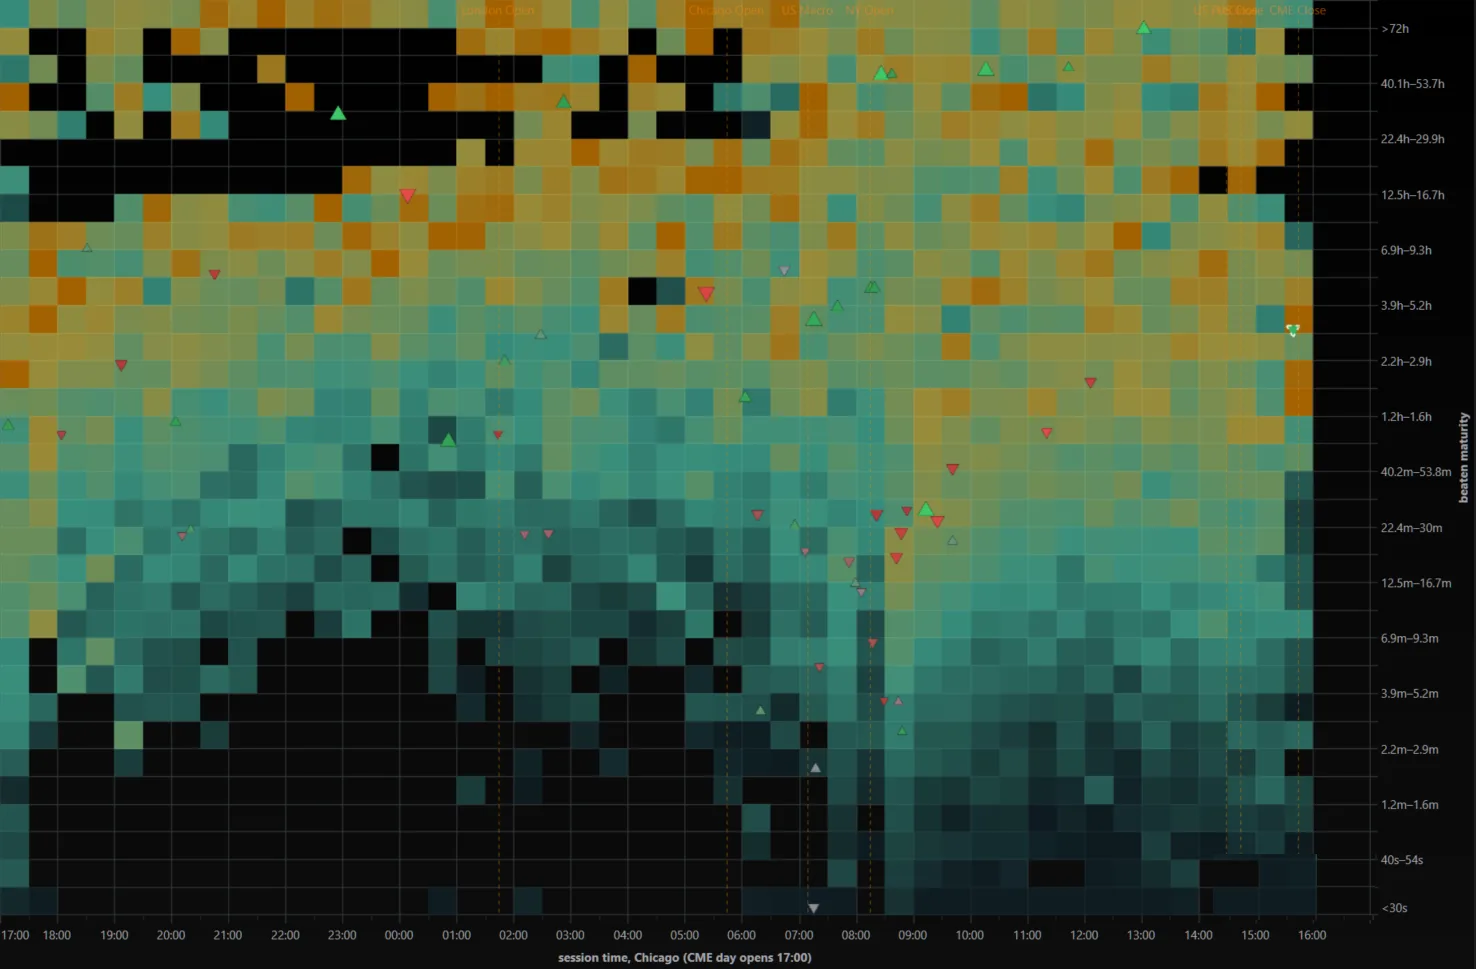
Variance Clock is the research workbench beside the terminal: session coverage, signature and shape, replay, liquidity maps. All of it computed on the same cached order flow the chart draws.
11 · Foundation
CME market-by-order feed via Databento: every add, modify, cancel and fill, in sequence.
Order-level history kept in a column store, so a full session loads in seconds instead of minutes.
Everything you've loaded once stays on disk and comes back without touching the server.
Resilient live streams that resubscribe on gaps and notice silence before you do.
SciChart on DirectX 11 with one UI thread per chart, so a busy chart never stalls another.
Request access
Nodus is in private use today. If you trade CME futures and want to watch it run on a session you know, write to us.